












Owners mourn spoiled food after firmware update bricks Samsung smart fridges
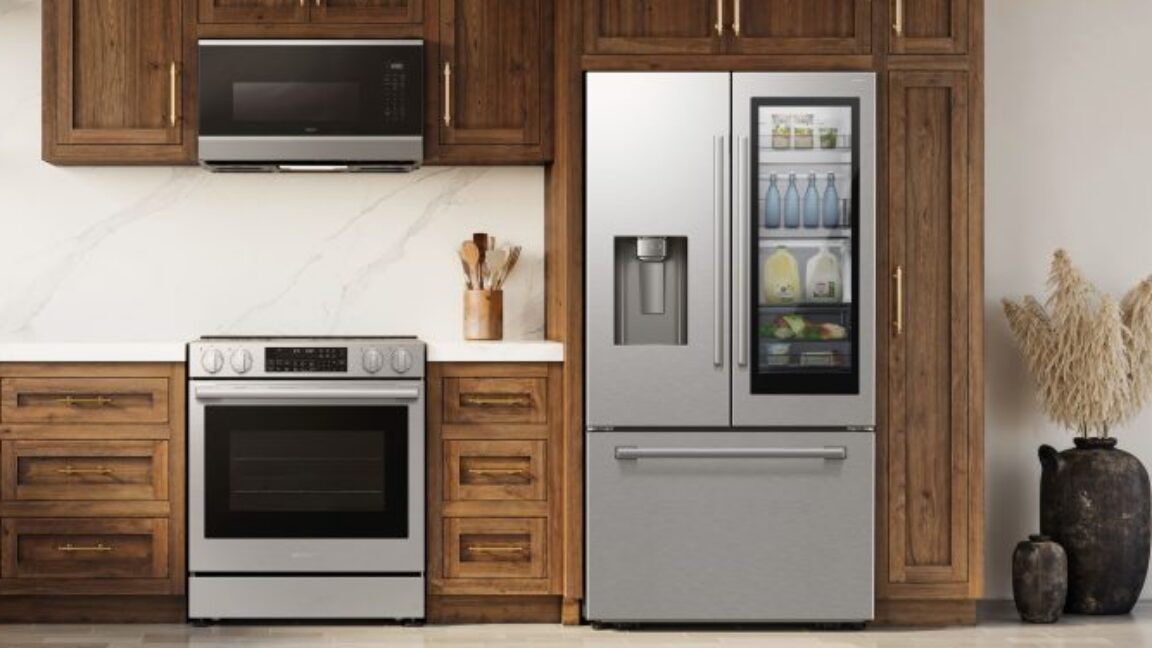
Some Samsung smart fridges stopped working on Tuesday due to a firmware update. Korean outlets were the first to report the problems, which affect Samsung’s Bespoke AI line of fridges. Star News Korea, per a Google-provided translation, said that most of the affected devices were four-door fridges from 2024 or later. Affected fridges “suddenly lost power and stopped functioning immediately after” trying to issue a firmware update through SmartThings, Samsung’s smart home platform, per Star News



















.jpg&s=2mCEuEllGtnR9Fds7jvEqh4kVYAHoCK_Blbgbcvr0Bs)